Scandlines' new green ferry

News: Scandlines – Digital twin to enable greener ferries

Industry-first digital climate twin to enable greener ferries owned by Danish ferry operator

Scandlines has chosen the Danish climate tech startup ReFlow to develop advanced climate twins of its latest “Zero-emission” ferry design using cutting-edge life cycle assessment (LCA) methodology.

The steel is currently being cut at Cemre Shipyard for the zero-emission vessel contracted by Scandlines for the Puttgarden-Rødby route. Over the following months, ReFlow will build a detailed life-cycle model representing the vessel from its construction to its end of life many years from now. The model will show the environmental impact of the ferry, not only in its use but also from its construction at Cemre Shipyard along with the installed equipment. The digital “climate twin” will make it possible for Scandlines to run simulations on the use of new green technology on the ferry something that is nearly impossible today.

A future-proof investment

Life Cycle Assessment (LCA) is a holistic approach to assessing the environmental impact. It can include all life cycle stages of a vessel and not just the fuel consumption that is common practice in the maritime industry. Incorporating all life cycle stages, the shipowner will get a complete overview of the vessel’s emissions in its entire life, including the fuel consumption. “Our new zero-emission vessel will be electrically powered, so it makes good sense for us to look at the entire life cycle and understand the remaining emissions so they can be improved over time,” states Fini A. Hansen, VP Fleet, Scandlines.

What is a digital twin?

A digital twin is a digital representation of physical products, in this case, a ferry. The digital twin concept became famous in 2010 by NASA, allowing for digital modeling of its space ferries before departure. Today the use of digital twins is widely shared in many industries as it allows for low-cost simulations before installing expensive equipment.

An industry first

The ferry will be environmentally assessed using ISO-backed Life Cycle Assessment methodology – a tool well-known in other industries like automotive and construction but very new to the maritime industry. “We are very excited about the new cooperation and also looking forward to the world premiere of applying life cycle assessment to a complete ferry – it is an industry first to our knowledge,” states Rasmus Elsborg-Jensen, CEO and Founder of ReFlow.

The assessment of the ferry design and its proposed life cycle is no small task. It will run over the next three months and include detailed information on the building processes and chosen equipment aboard.
“It is our ambition to provide Scandlines with a granular understanding of the emissions associated with, not just the fuel use, but also the vessel itself, allowing for future “plug and play” scenarios where new greener technologies can be assessed on the vessel before an investment” states Rasmus Elsborg-Jensen, CEO and Founder of ReFlow

In line with new EU recommendations

The EU highlights the use of Life Cycle Assessment (LCA) as the go-to tool for providing environmental data on products and processes.New EU initiatives like the Green Deal call for more environmental data and product transparency, and Life Cycle Assessment provides exactly that. “Using life cycle assessment, the shipowners can get a more granular understanding of the current environmental profile of a vessel but also, more importantly, understand the future roads towards a greener vessel – a patch that often is linked with partnerships and new technologies,” comments Rasmus Elsborg-Jensen, CEO and Founder of ReFlow

A new digital approach will enable green procurement

ReFlow will, jointly with the traditional Life Cycle Assessment process, incorporate the digital solution that makes it possible for suppliers to make and submit their LCA calculations directly to Scandlines, speeding up the process when selecting new suppliers or evaluating current ones. Several maritime Original Equipment Manufacturers (OEM) are already using the digital platform, which makes it possible to cut the time and cost associated with a life cycle assessment of the products by over 80% compared to traditional manual approaches.
“The digital solution from ReFlow will be a good enabler for our green procurement strategy as it allows our current and future suppliers to provide climate data on their products. Product climate data will allow us to evaluate products and eventually lower the carbon footprint over time,” states Fini A. Hansen, VP Fleet, Scandlines.

Data for zero-emission Scandlines freight ferry for the Puttgarden-Rødby route:

Length: 147.4 m
Breadth: 25.4 m
Design draft: 5.30 m
Freight capacity: 66 freight units (abt. 1,200 lane meters)
Max. number of passengers: 140
Service speed: 10 knots

The New Zero Emission Ferry from Scandlines:

Scandlines' new green ferry

Press contacts

Anette Ustrup Svendsen
Head of Corporate Communications
Mobile: +45 26 777 000
Email: anette.ustrup.svendsen@scandlines.com

Rasmus Elsborg-Jensen

Rasmus Elsborg-Jensen
CEO, Founder, and EU Climate Pact Ambassador
Mobile: +45 3115 5508
Email: rej@re-flow.io

ReFlow logo
Abstract satellite photo of the world

Is zero-emission products possible? The challenge behind carbon neutrality

Is zero-emission products possible?
The challenge behind carbon neutrality of products

Have you ever questioned what makes a product zero-emission? If so, we’re here to shed some light on what can often be confusing to those beginning their journey towards calculating their emissions. Throughout this article, we attempt to provide some clarity on the differences between emissions classifications and provide insight into why oftentimes calling your products ‘zero emissions’ can be misleading to stakeholders and consumers.

Understanding Your Emissions-– Scope 1, 2 and 3

Scopes 1 & 2

Greenhouse gas emissions can be understood within the context of three scopes [1], namely scopes one, two, and three. Scope one is what we define as direct emissions. Direct emissions constitute the most well-known and classic example of fuel combustion such as everything that comes out of an exhaust pipe or chimney and enters the atmosphere directly.

Scope two consists of indirect emissions and can be understood through the eyes of company consumption and other actions. An excellent example of this would be energy consumption. If a company utilizes a production line that demands electricity or if they have systems requiring heating or cooling this would fall into what we define as scope two.

Scope 3

Scope one and two have had their fair share of attention and reporting for the many past years. However, recently scope three has overtaken interest within environmental circles, and for good reason.

Scope three can be trickier to understand and assess. Actions that fall into scope three can often possess some of the highest amounts of atmospheric emissions and in some cases, more emissions can be expelled from actions in scope three, than from scope one and two combined. To break it down, scope three is defined as indirect emissions, just like that of scope two. Although, scope three is different in that it encompasses the indirect emissions related to activities throughout a company’s supply chain.

Essentially all emissions related to the upstream and downstream supply chain fall into scope 3 and include, but are not limited to, emissions from raw material extraction, transportation, and even infrastructure. These actions can be difficult to account for, however, they are necessary in order to fully understand emission outputs in their entirety. This is possible with life cycle assessments.

What About Zero-Emission Products?

The only zero-emissions product is a product that reports on all scopes of emissions–including scope 3. ‘Zero-emissions’ products are everywhere. Although, in order to fully claim a product has zero-emissions qualities a Life Cycle Assessment (LCA) must be conducted where the scope one, two, and three emissions are accounted for. Unfortunately, this isn’t common practice for many companies making sustainable product claims.

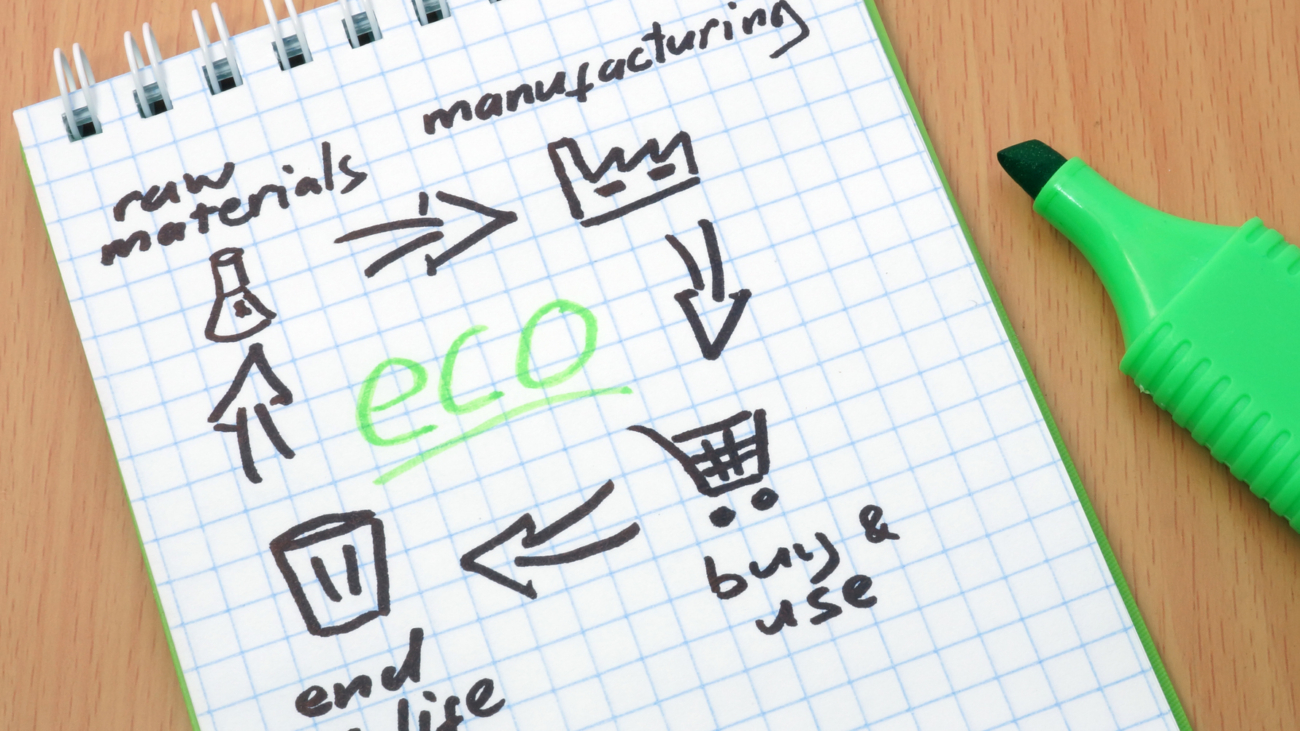
Irresponsible burden-shifting can mean that different activities with different emissions outputs end up being weighed equally and can therefore result in greenwashing. For this reason, assessing a product from cradle to grave, or from the point of raw material extraction for the product’s creation, all the way up until the complete disposal of the product is instrumental in making honest claims about the product’s entire output of emissions. Governing bodies are currently regulating legislation to lower industry emissions where documentation and reporting for scope 3 are on the horizon. This is pushing many companies into taking these as signs to become fast movers and engage in early reporting.

Is Zero-Emission Achievable?

Selling a product on the basis that it has zero emissions without first calculating the different impacts turns a blind eye to an essential part of holistically assessing the product. The first step toward creating a zero-emissions product is through creating a baseline of everything you know about the product. This is not easy work, but utilizing tools like Life Cycle Assessment (LCA) calculators is easily one of the best places to start.

Tools like life cycle assessments (LCAs) allow you to quantify products with both generic data and company-known data allowing for more in-depth and transparent reporting. Fortunately, extensive digital libraries are also available to make this data even more accessible to everyone.

From here it becomes easier to calculate the scope of emissions, see where hotspots are, and where attention is needed to get closer to a truly sustainable product. It’s safe to say, what would have been deemed impossible just 30 years ago has today become achievable through the use of these impact assessment tools [2].

Read more

European Commission. (28 January, 2021). Screening of websites for ‘greenwashing’: half of green claims lack evidence. Retrieved on 28/12/2021 from https://ec.europa.eu/commission/presscorner/detail/en/ip_21_269

European Commission. (2021). Consumer policy – strengthening the role of consumers in the green transition. Retrieved on 10/06/2022 from https://ec.europa.eu/info/law/better-regulation/have-your-say/initiatives/12467-Consumer-policy-strengthening-the-role-of-consumers-in-the-green-transition_en

European Commission. (2021). Environmental performance of products & businesses – substantiating claims. Retrieved on 10/06/2022 from https://ec.europa.eu/info/law/better-regulation/have-your-say/initiatives/12511-Environmental-performance-of-products-&-businesses-substantiating-claims_en

References

[1] Greenhouse Gas Protocol. Corporate Standard. Retrieved on 10/06/2022 from https://ghgprotocol.org/corporate-standard

[2] Bjørn, A., Owsianiak, M., Molin, C., Hauschild, M.Z. (2018). LCA History. In: Hauschild, M., Rosenbaum, R., Olsen, S. (eds) Life Cycle Assessment. Springer, Cham. https://doi-org.ep.fjernadgang.kb.dk/10.1007/978-3-319-56475-3_3

Glass ball reflecting light from sun and river in green landscape

Life Cycle Assessments for the Climate – A tool for the circular economy

Life Cycle Assessments for the Climate
– A tool for the future of the circular economy

Life cycle assessments, commonly known as LCAs, go beyond classical approaches to assessing environmental consequences of products, industries, and company actions. LCAs provide companies a more in depth understanding of the impacts they have on the environment by accounting for more stages than just the use stage.

Taking the emissions released from the distribution stage, for instance, is also important to consider when accurately calculating your overall emissions. Think of a truck with heavy cargo on its way to a warehouse or factory – emissions are created during this necessary process of transporting a product or getting it to its final destination. This is the case with all the stages within a life cycle assessment.

The Circular Economy

A circular economy goes beyond the typical buy, sell, and dispose mentality. This closed loop thinking incorporates holistic and environmentally preferable solutions to a products’ life cycle, often by factoring in stages like reuse and recycling.

An LCA tool or a carbon footprint calculator is a good instrument which can be utilized to understand the most optimal ways for a product to best engage within the EU circular economy and become environmentally preferable products.

Cradle-to-Cradle & Cradle-to-Grave

Conducting an LCA on the granular level starts from the point of extracting the raw materials all the way up until the complete and eventual disposal of a product. This is commonly known as cradle-to-grave which is where the life cycle assessment gets its name. Cradle-to-grave refers to all of the stages the product experiences up until the point of which it is disposed of or no longer being used. However, incorporating additional stages such as recycling and refurbishment, adds a cradle-to-cradle concept which becomes necessary when engaging in a circular economy.

Other steps such as what occurs during resource processing, manufacturing, recycling, and disposal are also taken into account when calculating overall environmental impacts. Cradle-to-cradle provides a more holistic approach to life cycle analysis and incorporates circular thinking. With cradle-to-cradle, a products’ creation as well as its disposal and even actions beyond like recycling and repurposing as included. This is important because LCAs can aid in pinpointing hotspots where environmental impacts are greatest in a products life which, often as not, is not always the use stage.

Oftentimes the greatest environmental impact from a product can be found within the manufacturing or disposal stage where unfavorable methods are used and materials go to waste or where disposing of a product demands extensive steps to ensure safety to the public.

Two colleagues working on project

Carbon Footprint & Environmentally Preferable Products (EPP)

The carbon footprint is generally defined as the calculated output of Carbon dioxide and equivalents (CO2e) from any and all activities–anything from driving a car, to charging your phone, and even your new purchases.

Environmentally preferable products (EPP) or Sustainable Products (SP) take this carbon footprint into consideration and are generally defined as products and services that have a lesser or reduced effect on human health and the environment when compared to competing products or services that serve the same purpose.

The carbon footprint of products or activities can be calculated using a carbon footprint calculator where the results represent the quantity of CO2e emissions released into the atmosphere, thereby making it easier to assess products or activities on an environmental level.

Examples of environmentally preferable products can include:

  • Reduced packaging
  • Ease of reuse, refurbishment, remanufacture or recycling at end of life
  • Reduction of emissions and air contaminants
  • Improved energy and water efficiency
  • Use of alternative sources of energy and fuels
  • Reduced waste, and practices that support reuse and recycling
  • Use of renewable resources
  • Reduced exposure to toxins and hazardous substances
  • Greenwashing

    Greenwashing refers to when companies and organizations mislead their consumers or audiences by making them believe that a product, service they provide, or the organization itself is environmentally friendly or sustainable, when it is not. Deceptive claims that refer to products as environmentally friendly when important factors essential in accurately calculating the carbon footprint of the product are neglected often constitute greenwashing throughout many industries.

    So how do you avoid greenwashing?

    Being transparent on your calculations and method is one of your most powerful tools in avoiding claims of greenwashing. This means sharing how you perform your calculations and sharing your results with your value chain and the public.

    The Makeup of Life Cycle Assessments

    According to ISO 14040 and ISO 14044 – the leading standards for LCAs – an LCA is performed in four main phases or steps:

    • The first step in completing an LCA requires conducting an evaluation of what the goal and scope are, including a detailed definition of the product, its life cycle stages and modeling choices.
    • The next step involves taking inventory and listing all inputs (e.g. materials, energy) and outputs (e.g. waste) in each of the life cycle stages of the product. A good source of the product inputs is the bill of materials, which will often include information such as what kinds of raw materials can be found within the product and specifications of the composition like the specific weight, or mass of a component. This ensures that all the components required for assessing the product can be individually assessed and the products overall environmental footprint can be thoroughly documented. If not readily available, the bill of materials can often be easily compiled by engaging upstream suppliers. 
    • As the third step, an impact assessment is made to best understand where hotspots, or the points which demand more attention, are occuring.
    • Finally, following this step an improvement assessment can be made which provides a detailed analysis of the findings following completion of the LCA and often recommendations as to further improve the product or components environmental impact.
    • All in all, LCAs are a powerful tool in that they can help empower decision makers to engage in different methods and facilitate strategies that allow them to incorporate granular environmental thinking into their products.

      notepad with product life cycle and word eco. Recycling

      Carbon Footprint Accounting? Here’s what you need to know

      Carbon footprint accounting? Here's what you need to know

      Life cycle thinking in carbon footprint accounting

      Activity-based approach and spend-based approach are two common Greenhouse Gas (GHG) accounting (commonly known as carbon footprint accounting) methods. While both are compatible with life cycle thinking, they differ greatly in the origins of inventory data and emission factors. Distinct origins and characteristics of the data used in these two approaches lead to significant differences in the data collection process, resulting in GHG inventories with varying levels of details, specificity, representativeness, and accuracy, and accordingly the applicability of the accounting results to decision making for corporates, consumers, and regulators.

      Inventory: technical-physical data vs. financial data

      The activity-based approach necessitates engineering process data of the processes managed by the reporting company as well as its suppliers and service providers, e.g. Bill of Materials. The collected data are in physical units such as kilograms and kWh. They are principally process-specific primary data supplemented by secondary market average data. The data collection process usually takes time and effort, however, it yields detailed, representative, and consistent results.

      Differently, the spend-based approach requires exclusively financial data or purchases, and values are expressed in monetary units. Data from suppliers or service providers is not needed, thus reducing the time and resources for the inventory data curation process. However, financial data are subject to price fluctuations caused by varying exchange rates, changing market conditions, as well as other temporal and geographical factors. For instance, the same product bought in different purchasing conditions may have distinct GHG footprints, while the factual GHG emissions should remain the same. These complicate the spend-based approach and add great uncertainties not only to the financial inventories but also the GHG accounting results.

      In this video we discuss and explain the differences between Spend based and Activity based approaches

      Application: credible and consistent accounting vs. screening

      The accounting results developed based on the activity-based approach provide a good representation of the reporting company’s specific value chain activities. The accounting allows the reporting companies to conduct baseline setting and identify key contributors and accordingly develop emission reduction plans. Given the consistency and credibility of the primary data and high-resolution emission factors, the obtained accounting results can be used to track progress of the reporting companies towards reduction targets. 

      The spend-based method can be a helpful tool for corporates to approximate organizational or product-level footprints during the initial screening phase of the climate combat journey. However, given the lack of specificity and consistency in the inventory data and low-resolution emission factors, GHG accounting based on the spend-based method is not recommended to be used for reporting or monitoring. 


      References

      GHGP. (2011). Corporate Value Chain (Scope 3) Standard | Greenhouse Gas Protocol. https://ghgprotocol.org/standards/scope-3-standard 

      ISO. (2018). ISO 14064-1:2018 Greenhouse gases—Part 1: Specification with guidance at the organization level for quantification and reporting of greenhouse gas emissions and removals. ISO. https://www.iso.org/cms/render/live/en/sites/isoorg/contents/data/standard/06/64/66453.html